Transparency Report 2021
In 2021 coffee producers all over the world expertly turned ripe cherries into green beans full of potential. We roasted 22,907kg of these green beans, resulting in 19,772kg of brown beans. We moved locations, roasted off-site, and gradually re-established a routine.
Thanks for coming along with us.
-Philipp, Laurel & David
Introduction

Welcome to our transparency report for 2021. Creating this has been a learning process and a chance for reflection and revision. Our aim with this report is to share a little about the complexities of the coffee industry and, fundamentally, why our roasts cost what they do. This isn’t a slick marketing presentation, but rather an attempt to understand the industry that we work in and our role in it.
We believe that transparency and accountability are processes between partners. For this reason we have shared our internal costs of production and profit margins. We cannot be transparent without also showing vulnerability. Your responses to our 2020 transparency report helped us to improve our coffee purchasing practices, we always welcome your questions and feedback.
In this report you’ll find maps, tables, graphs and perhaps too many words. Our aim with all of these resources is to illustrate the amount of work involved in producing each cup of coffee, and why each coffee costs what it does. Understanding the labour involved in coffee production and who performs this labour is as important as numbers in a table.
Sharing numbers is a way for us to be accountable to you, the coffee drinker, and to the people from whom we buy coffee. However, we also have a responsibility to explain (to the best of our ability) what these numbers actually mean. In a complex and confusing industry it’s tempting to compare coffees and prices with one another. Many of the importers that we work with were cautious about sharing FOB and Farmgate prices with us, not because they were unwilling to share the information, but because they were worried that it would be shared without context and easily misconstrued. What makes this even more difficult is that terms are not standardised across the industry, Farmgate prices can mean many different things, just like there’s no universal definition of what makes “black” or “gold” honey processed coffee. Comparing one coffee lot with another can be a little like comparing apples with oranges, or, more accurately, comparing cherries with beans.
Context is important because the way that coffee is processed and traded differs greatly between countries, regions, and even individual farms. Hernan Montano from Finca Los Laureles in Colombia sells parchment coffee to an exporter, whereas the small-holder farmers in Nyabihu, Rwanda sell unprocessed cherries to the neighbouring Vunga Washing Station. Coffees in Kenya tend to fetch a very high FOB price (the price paid for a coffee when it leaves the country), but farmers see proportionately little of this revenue, partially because of the colonial-era auction system that dominates their national industry. The owner of Finca Santa Clara in Brazil, Paul Alfonso, is a founding member of the export company Sancoffee. This allows him to maintain a large degree of control over the marketing and selling price of his coffee. In the case of Finca Santa Clara, the FOB price and the price paid to the farmer are exactly the same.
Numbers that we can share with confidence and clarity are the prices that we charge for roasted coffee and our internal costs of production. It is not ethical to demand that importers and exporters share their figures without opening the books ourselves. Keeping you informed about our operation is the easiest way to explain why coffee costs what it does, and why prices must increase over time. Transparency should be more than a “buzz word,” but a process through which we all make ourselves vulnerable and learn about the industry in which we work. This is only our second annual transparency report, and we suspect that it is more informative for us than it is for coffee drinkers. Creating this report is a chance to review our practices and create goals for the future… perhaps it could more accurately be called a progress report, or an accountability report.

At Vote, we don’t claim to have an intimate knowledge of the value chain for every coffee that we’ve purchased. There are still large gaps in our own understanding and knowledge and we rely heavily on importers and exporters to share their expertise with us. You will see these gaps reflected in the differing amounts of information that we can share about each coffee here. One of the ways that we hope to learn more is by purchasing coffees from the same growers or cooperatives year after year so that we can become financially reliable partners, establish personal relationships, and understand more and more about the coffee we roast and drink. By 2023 we aim to purchase 90% of our coffee volume from producers that we have worked with for over 2 years, and will continue working with for at least 2 more years.
We would like to share more information about the seasonal labour that the coffee industry relies on. Coffee picking is seasonal work that has become especially precarious during the Covid pandemic. Coffee pickers do not always receive benefits and health insurance from their employers, and lockdowns prevented workers from traveling across national and regional borders for work. There are some initiatives trying to address these vulnerabilities, and we hope to work with farm-owners who create sustainable work environments. In 2021 Luis Alberto Jojoa, based in Huila, Colombia, participated in the Manos al Grano initiative: a project that aims to create a locally-regulated framework for paying coffee pickers in a legal and ethical manner. It includes health coverage, transparent wages, and training.
We encourage you to dig a little deeper and understand that the foundation of the coffee industry is still the work of millions of small-scale farmers around the globe. Each farmer works in their own unique context and faces different challenges: securing and paying for fertilizer, mitigating the impact of climate change on their plants, transporting cherries or green coffee to mills, hiring staff during harvest, or liaising with export companies. Just like with any business, the challenges and rewards change year-to-year, region-to-region.
Value Chain Glossary
A short explanation of some coffee-industry terms that will help you understand our report. Let's go >>>
Green Coffee Purchasing - Interactive Map
View our interactive map here>>> and click on the pins to see the coffees that we purchased and roasted in 2021. You’ll find the same numbers listed in our transparency spreadsheet, alongside some more detailed information about the people who grew this coffee, and the unique contexts that influence their cost of production. Understanding the labour involved in coffee production and who performs this labour is equally as important as FOB and Farmgate prices. Our aim with this map is to illustrate the amount of work involved in producing each cup of coffees, and why each coffee costs what it does.

Green Coffee Purchasing - Tables and Graphs
To view statistics for all coffees roasted by Vote in 2021 (including price paid to farmer, FOB, EXW and wholesale prices) Click Here>>>. Prices are in EUR/kg and USD/lb. Any currency conversion was done at the point of sale, or based on the average exchange rate for 2021.

Cost of Production
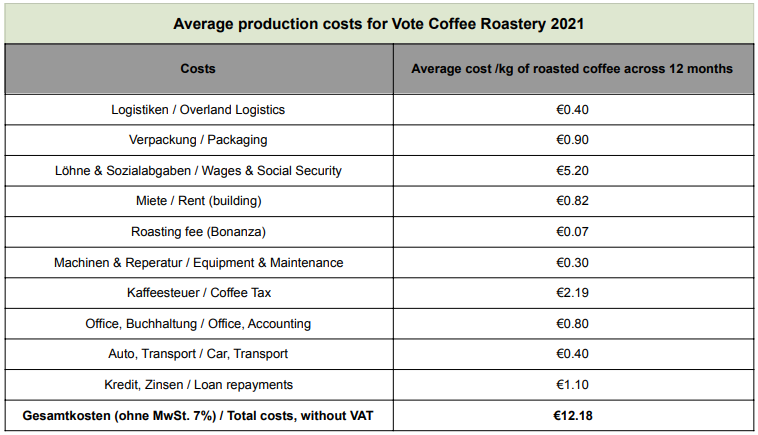
Profit Analysis
As mentioned in the introduction to this report, we do not make the same margin on every kilogram of coffee sold. Sometimes we lower our margins in order to make core coffees more accessible, sometimes we are able to increase the margin on high-performing coffees in order to compensate for lower margins elsewhere. Occasionally, when coffee quality is compromised, we lower prices in order to ensure that the coffee is sold fairly. View Profit Margins Here >>>
Donations
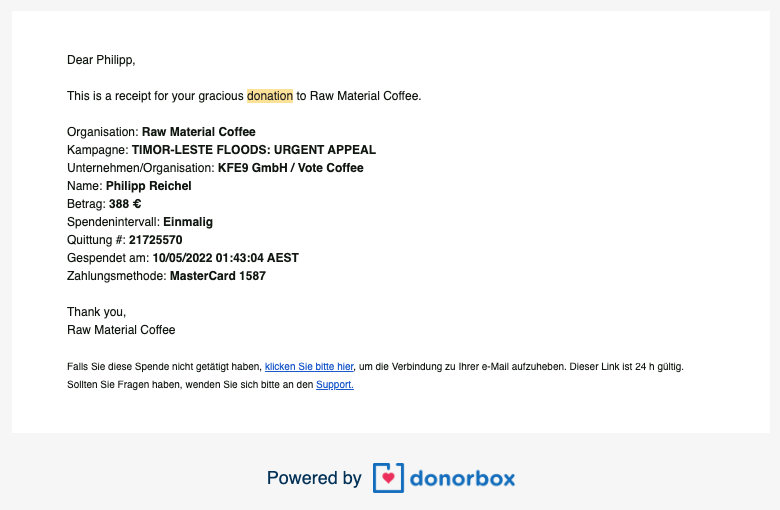
Timor Leste Floods: Raw Material Urgent Appeal
Following devastating floods in the Emera region of Timor-Leste in April 2021, Raw Material launched an appeal to help fund the repair and rebuild operation. The Koileki Natural coffee that we sold in summer of 2021 is grown and processed in this region.
We donated 1€ from every 250g retail bag of Koileki coffee sold, and 2€ from each of these collaboration packs.
Pure Hands : Yemen
In December 2021 we were lucky enough to roast a beautiful coffee produced in Wadi Al-maa, Yemen.
We donated 2€ from every retail bag sold to Pure Hands, a U.S.-based non-profit organization that work in education, food distribution, and medical assistance in Yemen. The hospital system is under extreme pressure due to a violent civil war, famine and covid. The donation will be spent towards providing medicine, medical equipment, and PPE to hospitals and healthcare facilities.
You can read more about the coffee and Pure Hands here.